
Headline
OverviewSpend, tokens and runtime count up when the page opens. Runtime adds the gaps between transcript lines and leaves out any over 30 minutes as time away, because first-to-last wall clock mostly measures leaving a session open.
Both coding agents write every turn to transcript files on disk, with the tokens it used. AI Usage is a native Windows app that reads those files and shows tokens, estimated cost and approximate runtime, overall, per project and per day. It makes no network calls, runs no server and needs no account: every number is recomputed from disk on each refresh.
%USERPROFILE%\.claude\projects\Tokens priced at Anthropic's per-token API rates, from a built-in rate card you can override.
%USERPROFILE%\.codex\sessions\What these tokens would cost through the OpenAI API. Codex is often used on a flat ChatGPT plan, so this is not necessarily what you paid.
Both transcript formats are undocumented and change between versions, and each one hides a few traps that would quietly skew the totals. A bad line is skipped with a warning; the parse keeps going.
Scroll inside the frame. Every number in these is invented: they are captured from the synthetic transcripts aiusage demo-data writes.
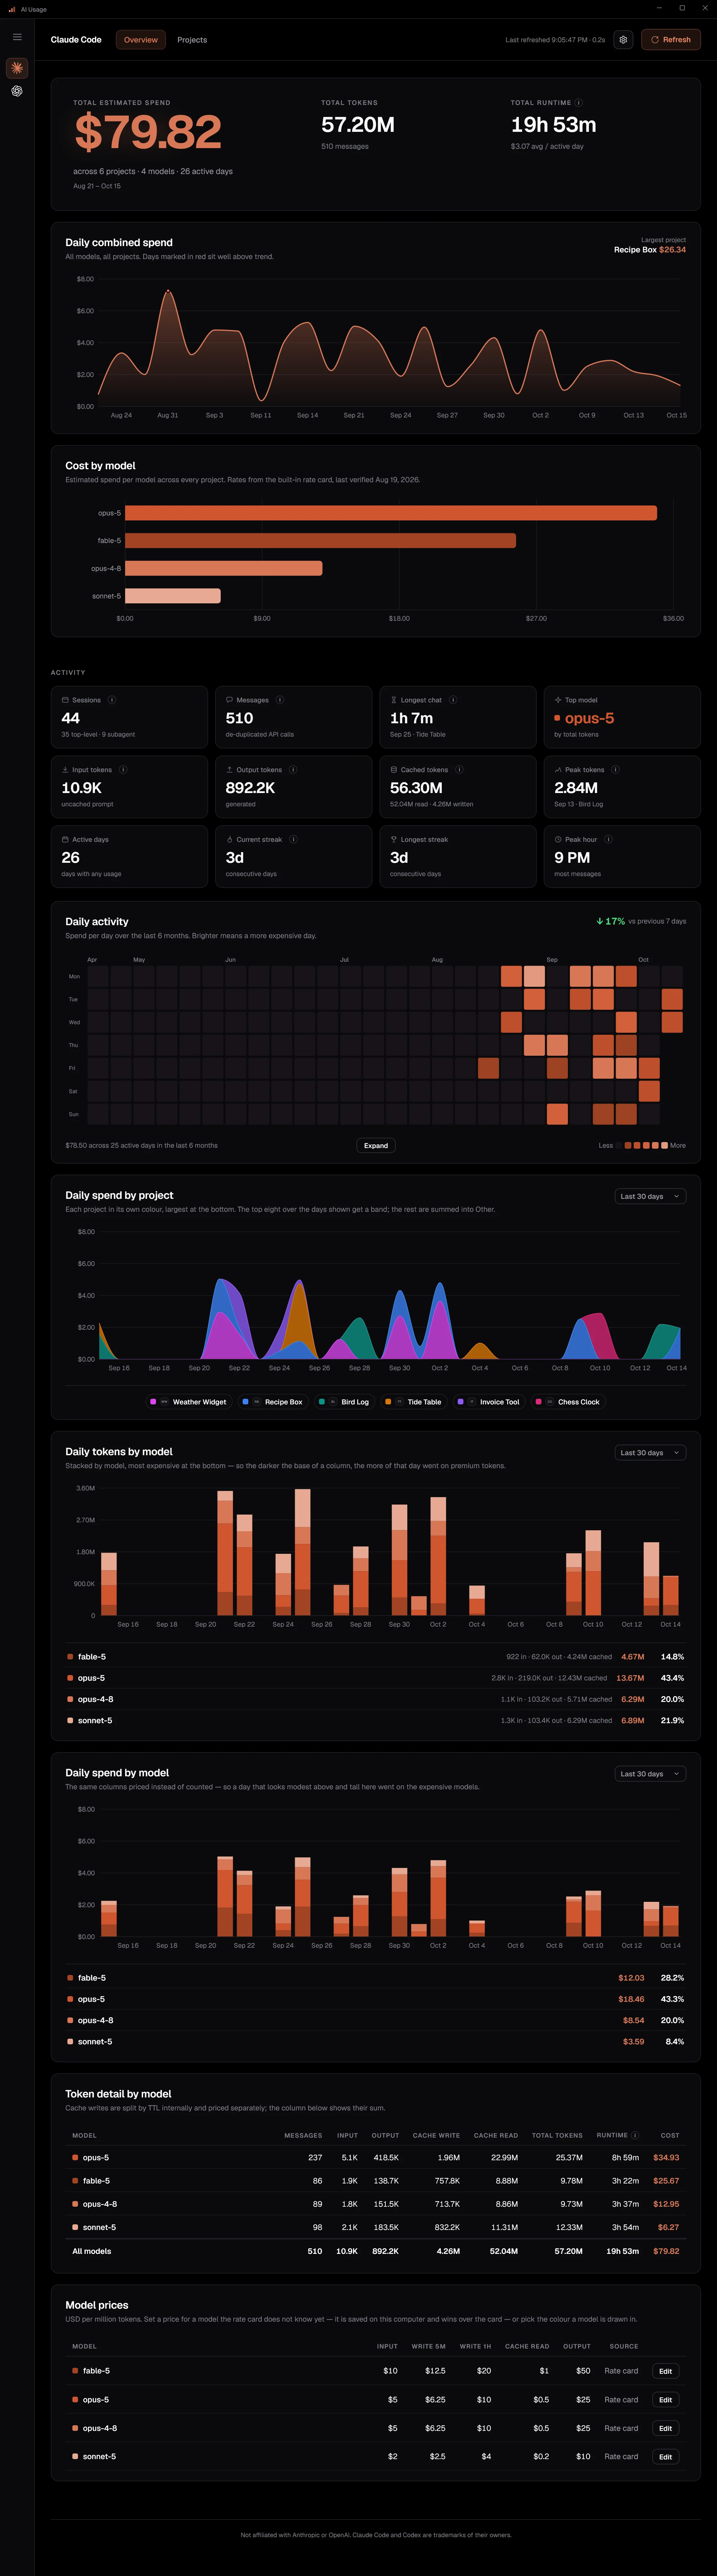
Drawn here from a fixed random seed, so every number is invented. In the app they are hand-drawn on XAML shapes, without a chart library.
Spend, tokens and runtime count up when the page opens. Runtime adds the gaps between transcript lines and leaves out any over 30 minutes as time away, because first-to-last wall clock mostly measures leaving a session open.
A smooth area over every recorded day, on a curve that never overshoots, so idle days stay flat. A day well above trend turns red. The corner names the largest project, or on a project page, the peak day.
Dearest first. A model's shade encodes its price everywhere it appears: the darker the shade, the more expensive the model. The rate card's last-verified date sits under the title.
Twelve figures in three rows. The two records count chats, not files: a subagent's tokens and cost are folded into the chat that started it. Each card has an info tip that says how it is measured. A project page leaves out the third row.
Spend per day for 26 weeks, against the previous 7 days in the corner. Brighter means a more expensive day: the ramp brightens in the dark theme and darkens in the light one. Expand opens every day on record, six months to a row.
Stacked areas, largest project at the bottom. The top eight over the days shown get a band and the rest, hidden projects included, are summed into Other. Fills are mixed toward the panel rather than made translucent, so overlaps never darken.
Two charts in the app, one above the other. The most expensive model sits at the bottom of each column, so the darker the base, the more of that day went on premium tokens. The spend chart prices the same columns, so a day that is modest in tokens and tall in spend went on the dear models. Each has its own range: last 30 days, last 60, or all.
A ranked list looks the same whether the top project is 60% of the spend or 15%; a ring does not. Hover a slice and the rest fade, with the legend fading in step. Past the top nine, projects are summed into Others. A slice or a legend row opens its project.
Each project's spend and share, a bar split by model, tokens, runtime, sessions and active days. Logos are set from the ⋯ menu or by dropping an image on the card. Try the menu.
The rate in use for every model, and where it came from. Edit opens the editor: a price set here wins over the rate card for that model only, and every figure is recomputed with it, archived days included. The same editor picks the model's colour from shades of the agent's accent, each clearing 3:1 contrast.
One row per day and model, newest first, for the project open.
Closing the window keeps the app in the tray, where hovering the icon shows today's spend for each agent and right-clicking it gives this menu.
config\pricing.json or config\codex-pricing.json.<synthetic> turns, which made no API call, are not counted as a model or a message.%LOCALAPPDATA%\AI Usage Native\: settings, the archive, logos and colours. Open settings folder is in Settings.settings.json: the local UTC offset for day boundaries, the first day of the week, and the idle cutoff for runtime.projects.json: merges and display names by hand, for each agent.AIUsage.exe. It carries its own .NET and Windows App SDK.tools\Install.ps1 builds from source, adds a Start menu entry and lists the app under Installed apps. Uninstalling keeps your data unless you ask.aiusage parse claude or codex prints totals and diagnostics: duplicates skipped, output recovered, files reconciled.aiusage demo-data writes invented transcripts for both agents, to try the app without your own.